Climbing Data – Rack Optimization
My friend Jeffery has been looking for interesting data to visualize, and the other day he showed me a neat visual that he was making from some climbing data he pulled together. As our friendship has often been rather competitive, I decided to dig for some climbing data of my own, and found a decent set from drjman on reddit. There were a few erroneous values in it, but after filtering those out the data cleaned up rather nicely.
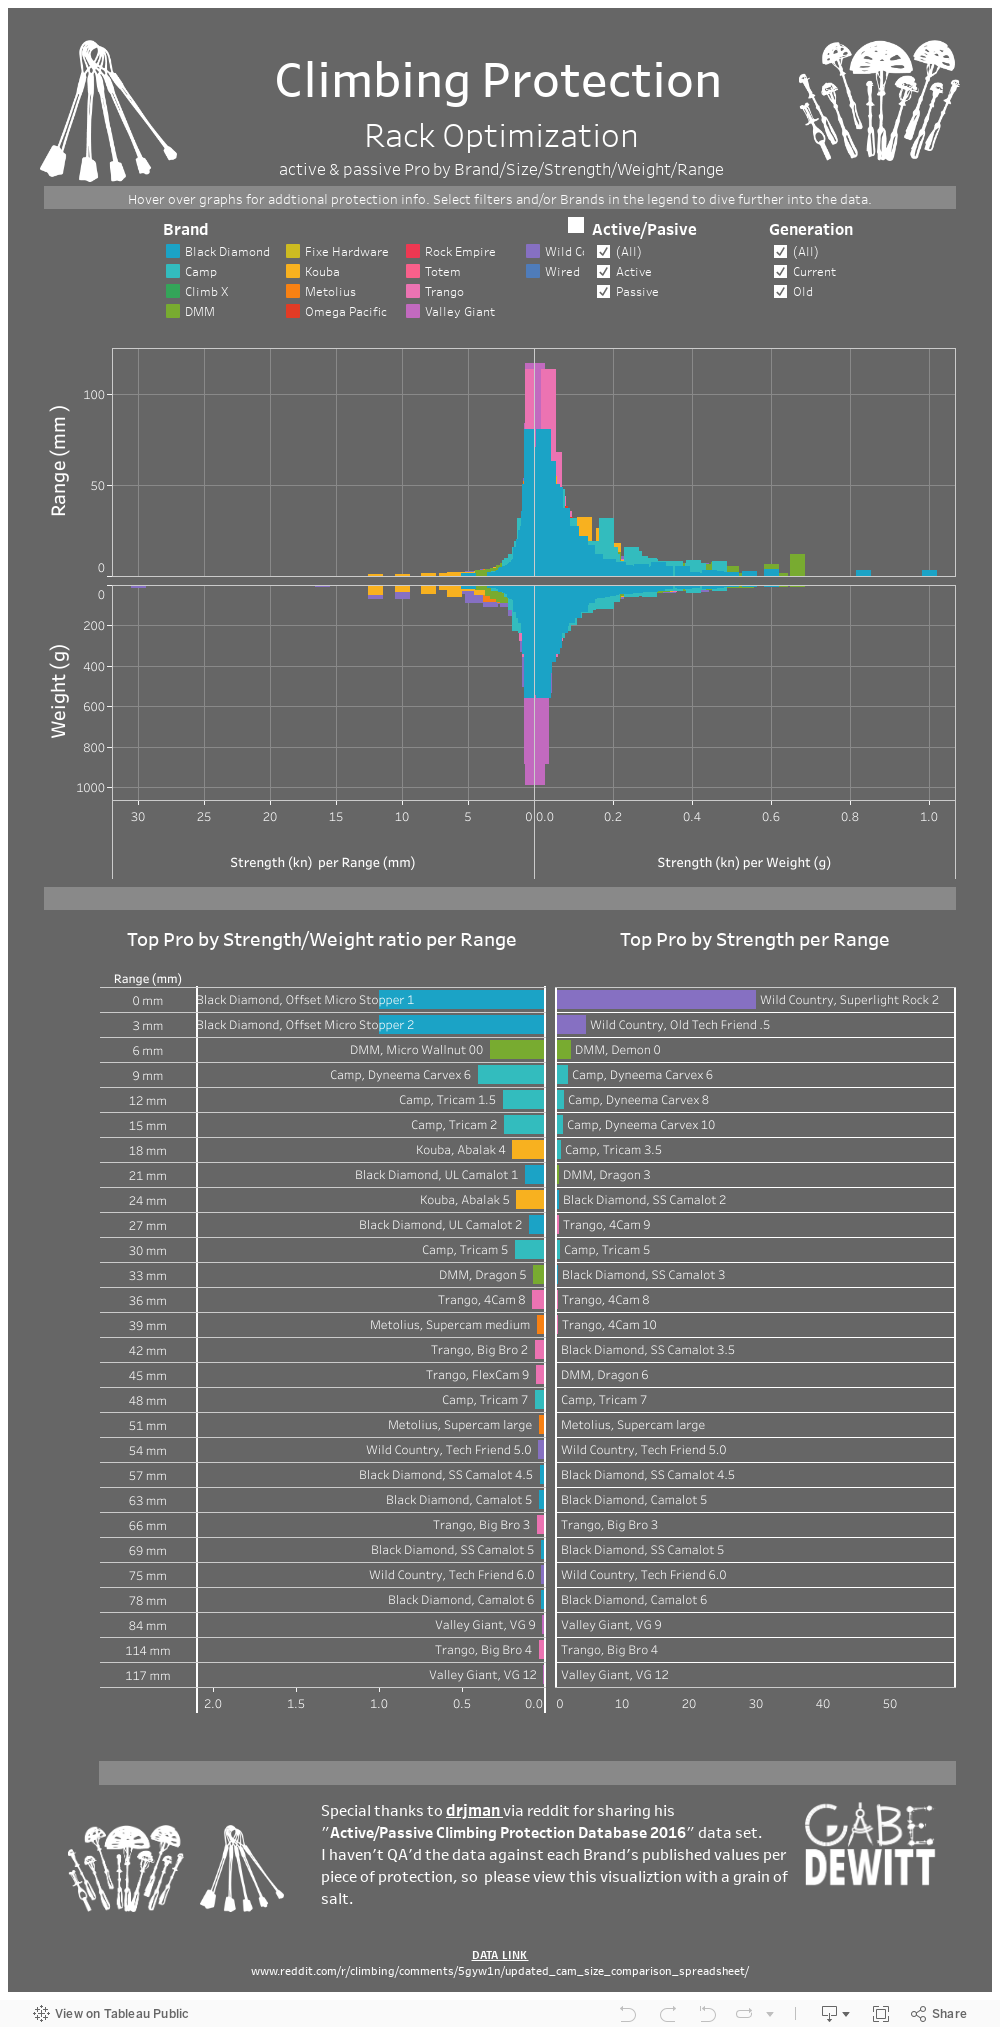
Without getting overly complex, I thought it would be cool to determine what gear would be the strongest per the protection’s weight and also placement range. So, I created an optimization quad graph that shows just that. I then bucketed the placement ranges into increments of 3mm, and filtered by the best performing gear in each of the bucketed ranges. The two bottom most graphs display lists of climbing protection (active and passive, old and current), with one optimized by a Strength to Range ratio in 3mm incremented placement ranges, and the other by Strength to Weight ratio in 3mm incremented placement ranges.
Depending on what you’re looking to climb, these two lists form a pretty decent optimized trad rack.
I’m sure there’s lots of gear that’s been left out of this analysis, but feel free to let know what else I should consider adding/fixing.
Have fun playing with the filters, and happy climbing!