America’s Pulse
Each U.S. state is represented in the House in proportion to its population as measured in the census, but every state is entitled to at least one representative
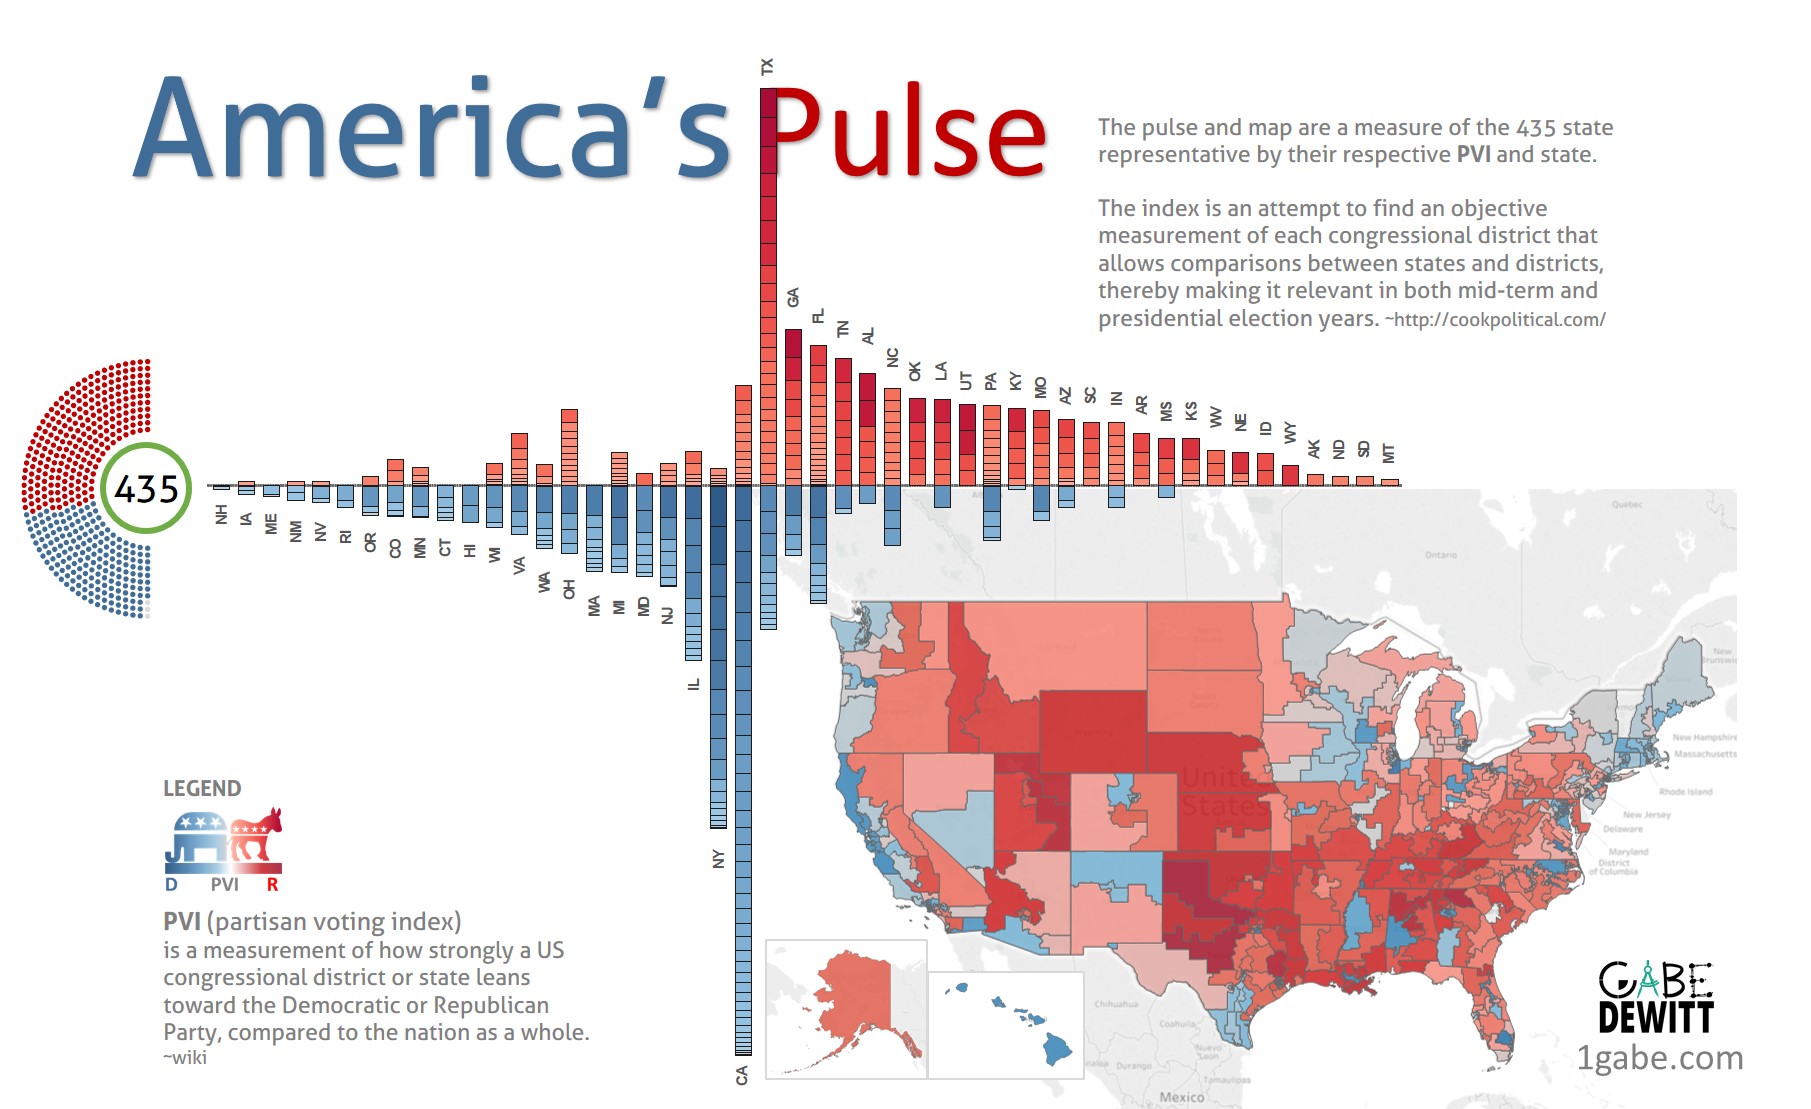
America’s Pulse, a Tableau Generated Chart and Map measuring the 435 State Representatives by their respective PVI and State.
PVI (partisan voting index)
is a measurement of how strongly a United States congressional district or state leans toward the Democratic or Republican Party, compared to the nation as a whole. ~wiki
Each U.S. state is represented in the House in proportion to its population as measured in the census. ~wiki
The index is an attempt to find an objective measurement of each congressional district that allows comparisons between states and districts, thereby making it relevant in both mid-term and presidential election years. The Cook Political Report
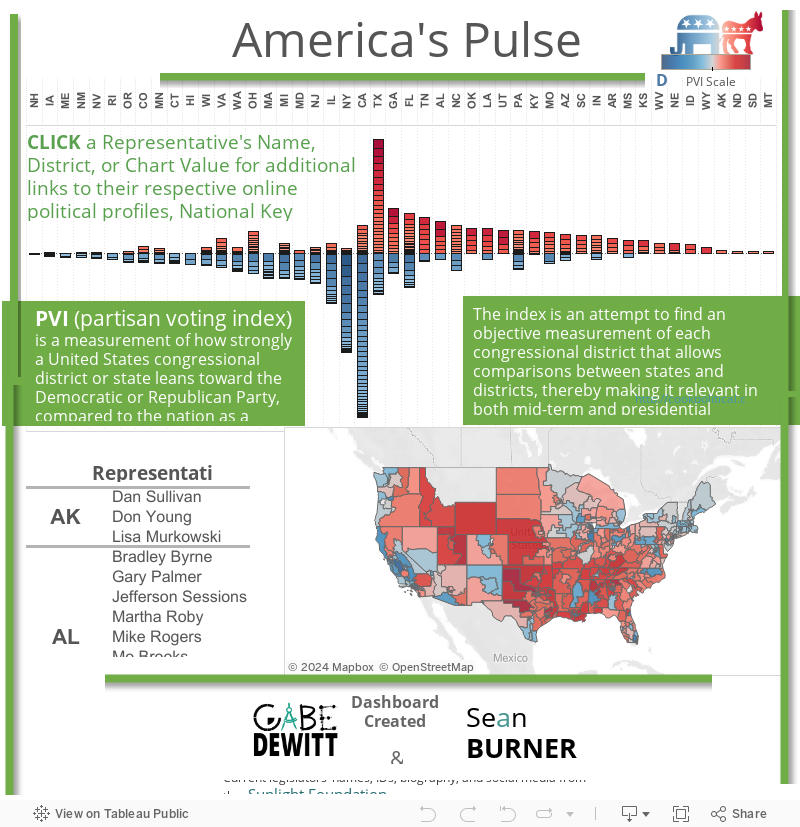
Interactive Dashboard – Get to know your State Representative
CLICK a Representative’s Name, District, or Chart Value for additional links to their respective online political profiles, National Key Voting, and social media.


Leave a Reply
Want to join the discussion?Feel free to contribute!